

November 1, 1968 — June 13, 2026
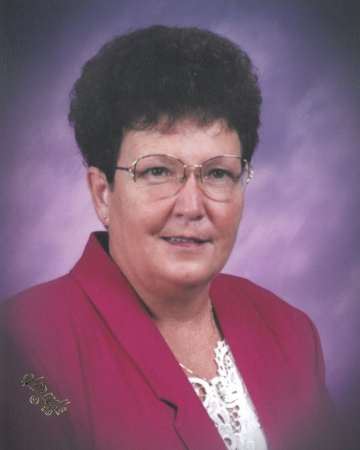
William “Bill” Charles Huntington, age 57, of Beamsville, passed away on Saturday, June 13, 2026 in a motorcycle accident on his way home.
Bill was born on November 1, 1968, in Greenville, Ohio, to the late Charles and Marjorie (Hunt) Huntington.
In addition to his parents, Bill was preceded in death by his sister, Amy Beth Hughes; his brother, George Michael Huntington; and his brother-in-law, Jim W. Allion.
Bill is survived by his loving sisters, Becky Huntington Allion of Wauseon, Ohio, and Terri Huntington of Cincinnati, Ohio; nieces and nephews, Katy (Dan) Johnson, Evan (Ashley) Allion, Meghan (Ryan) Murray and Andrew Frazier; as well as numerous great nieces, nephews, extended family members, and friends who will cherish his memory.
He was a 1987 graduate of Greenville High School. Bill dedicated many years of service to Crown Lift Truck in New Bremen, OH and was also formerly employed by Whirlpool in Greenville. He was a proud member of the Greenville VFW Post 7262, American Legion Post #140, and Fraternal Order of Eagles #2177.
Many knew Bill by his beloved nicknames, “The Gentle Giant” and “Big Bill.” These names perfectly reflected both his stature and his kind-hearted nature. Bill was always lending a hand, especially at the local clubs he supported. Whether building fences, repairing something that was broken, or helping a friend with a project, he could often be counted on to get the job done. Bill enjoyed working on cars, riding his Harley motorcycle, playing cards, and spending time with his family and friends. His kindness, dependability, and friendship will be deeply missed by all who knew him.
Memorial contributions may be made to the Greenville VFW Post 7262, American Legion Post #140, or Fraternal Order of Eagles #2177.
A Celebration of Life will be held from 1:00 PM to 5:00 PM on Saturday, July 25, 2026, at the Greenville VFW Post 7262. The family requests that you bring your favorite stories and a picture to share of Bill.
Online condolences may be shared with the family by visiting www.tributefuneralhomes.com.